The Indicators drop-down (Figure 6) includes a range of bushfire weather variables and risk indices commonly used by emergency services in Victoria, organised into themes/groups.
Select the indicator you want be displayed on the map.
Only one Fire or Weather indicator can be displayed at a time.
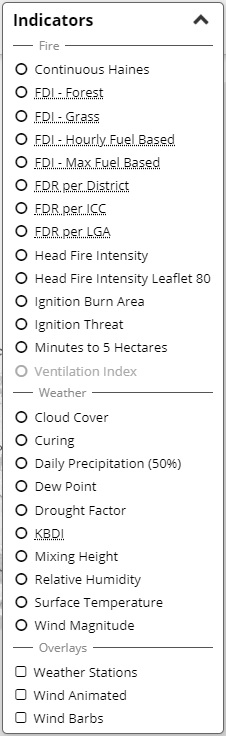
Figure 6. Indicators drop-down
Table 2 provides the descriptions, source, temporal and spatial resolution of each indicator available in Foresight.
Extra information about some of these products can also be found in the Product Guide and the Predictive Services Video Series.
To display weather stations, choose Indicators > Overlays > Weather Stations.
Automatic Weather Stations (AWS) are shown by a blue circle; non-AWS by a purple circle.
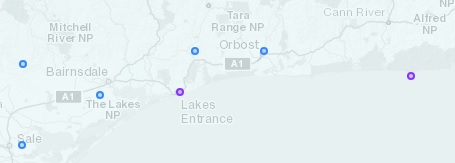
Figure 7. The appearance of weather stations
To display wind, choose Indicators > Overlays > Wind Animated … (Figure 8)
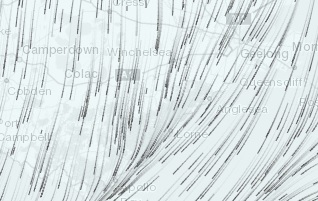
Figure 8. The appearance of the animated wind layer – Windy
… or Indicators > Overlays > Wind Barbs … (Figure 9)
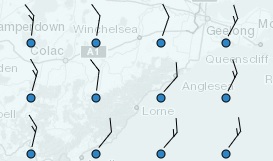
Figure 9. The appearance of the wind barb layer