In the Cell Data pop-up, click the Graph button ![]() to open the Meteogram window (Figure 15).
to open the Meteogram window (Figure 15).
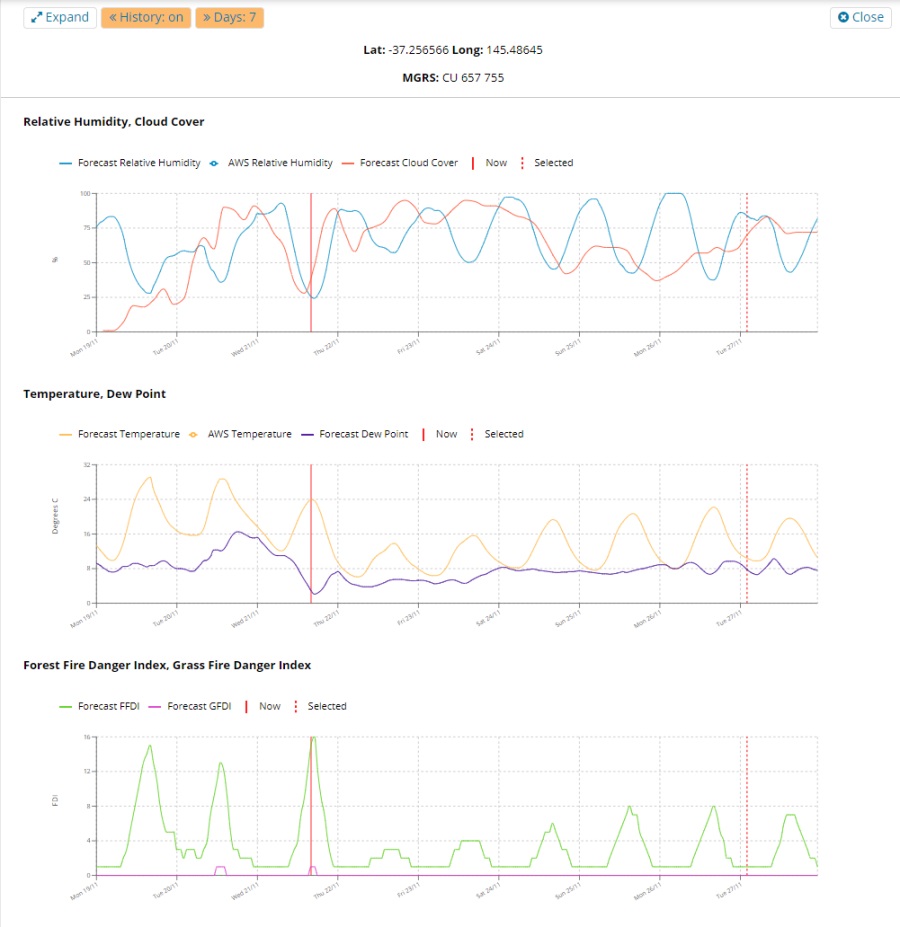
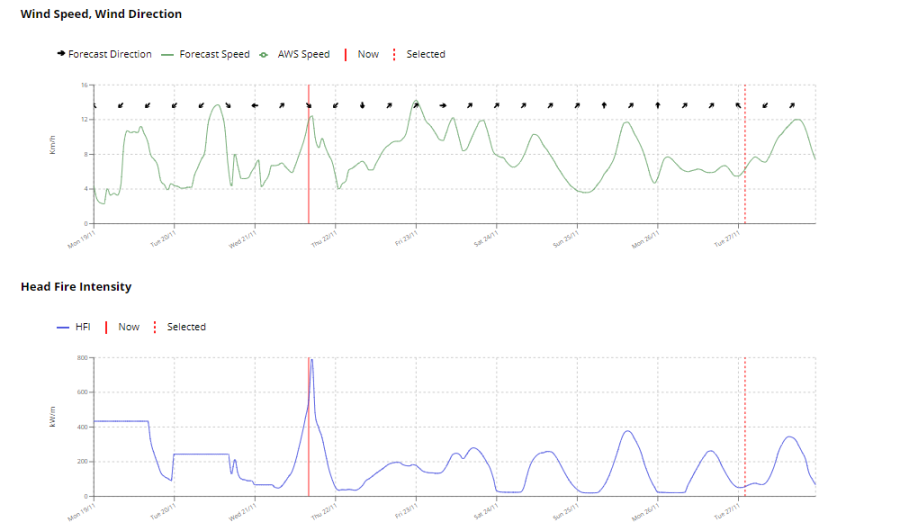
Figure 15. Meteogram window
A meteogram is a graphical representation of one or more meteorological variables with respect to time & weather (observed, or forecast) for a location.
Meteograms are useful for viewing trends in weather variables and indices and how they may be interacting over time.
This can be important for identifying risks in fire behaviour such as a lack of overnight recovery.
The Meteogram window displays six meteograms, which mirror those already available in other products (refer to Table 3).
Table 3
| Meteogram | Precedent Product |
| Relative Humidity and Cloud Cover | DELWP Fire District Meteograms |
| Temperature and Dew Point | |
| Forest Fire Danger Index and Grass Fire Danger Index | |
| Wind Speed and Direction | |
| Fireline Intensity – Bushfire conditions | Fire Behaviour Estimates |
| Fireline Intensity – Planned burning conditions | Planned Burning Fire Behaviour Estimates |
Each meteogram features vertical lines, with:
- a dashed red line indicating the selected date and time
- a solid red line show indicating now
See Figure 17 below:
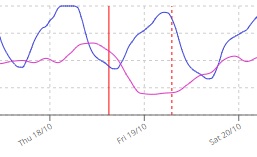
Figure 17. Now and selected time steps
Hover-over a data point to show the values for that time step (Figure 18).
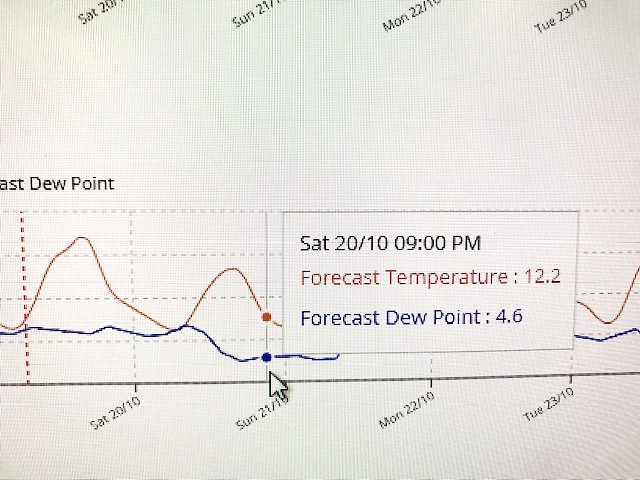
Figure 18. Data will appear upon scrolled over
Use the ![]() buttons to change the size of the meteogram window to fully or partially occupy the main window.
buttons to change the size of the meteogram window to fully or partially occupy the main window.
Click the ![]() button to include the two days prior to now in the meteograms.
button to include the two days prior to now in the meteograms.
Use the ![]() button to switch between visibility of a two-day or seven-day forecast period in the meteograms.
button to switch between visibility of a two-day or seven-day forecast period in the meteograms.
Automatic Weather Stations (AWS) are fully automated BOM weather stations that collect a large set of weather variables according to stringent methods.
Data is reported every 1/2 hour.
Non-AWS are weather stations that generally collect fewer variables and data is usually reported less frequently (e.g. twice daily).
Portable weather stations will also appear if any have been deployed in the state.
If a weather station is within 10km of the selected point, then observation data for the nearest weather station is also shown on the meteogram (Figure 19). 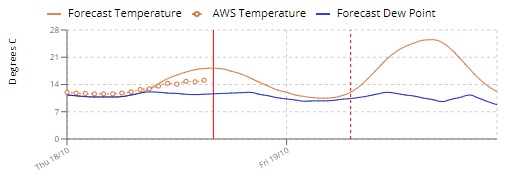
Figure 19. AWS observation data in a meteogram
This allows comparison of the forecast (predicted) conditions against the observed weather (actual) at the nearby weather station – which helps to assess the reliability of the forecast.