In the Time Bar, the vertical black marker ![]() identifies the selected Time Step, i.e. the time/date of the forecast you’re looking at.
identifies the selected Time Step, i.e. the time/date of the forecast you’re looking at.
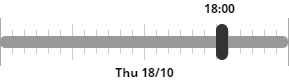
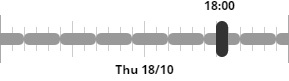
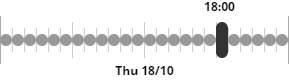
Figure 12. Differing length of data points in Foresight
You can click anywhere along the Time Bar to shift the Time Step.
Alternatively, you can move to a different Time Step by clicking within a meteogram (refer to Meteograms).
The grey data markers in the Time Bar indicate the duration of data points for the selected indicator, which may be:
- daily
- 3-hourly or
- hourly
The data point duration for each indicator is listed in Foresight indicator descriptions.
If there is an absence of data in the 9-day period, then the grey data markers will be absent at relevant time steps.