Common Datasets
The Foresight application displays datasets that are common to both Foresight Bushfire and Foresight Planned Burning versions. The Foresight products display key spatial datasets related to fire behaviour indices, fire danger ratings, fuel state, weather and incidents.
Table 2 describes the spatial data layers that are available across all Foresight products and accessed via the Indicators list within the Foresight application.
Table 2. Foresight indicator descriptions
| Indicator Group | Indicator | Description | Source | Source System/Product | Data point duration (temporal resolution) | Cell size (spatial resolution) | Accessibility |
| AFDRS (official) Indices and Ratings | Fire Behaviour Index – Hourly | Fire Behaviour Index (FBI) is a numerical scale from 0 to 100+ that indicates potential fire behaviour severity. | AFDRS | AFDRS gridded product / IDZ10161 | Hourly | 1.5 km | All users |
| AFDRS (official) Indices and Ratings | FDR per BOM District | The official public facing Fire Danger Ratings (FDRs) for Victoria. FDRs indicate the potential level of danger should a bushfire start. These apply to BOM weather districts and are based on highest FBI that is met by at least 10% of the district for that day. | AFDRS | AFDRS text product / IDV18556 | Daily | n/a (rating applies to each area) | All users |
| AFDRS (official) Indices and Ratings | FDR per ICC | For agency use only. The FDR for Incident Control Centre Footprints (as per JSOP 2.03) based on highest FBI that is met at least 10% of the ICC footprint for that day. | CFA/TSU | Area rating calculator (TBC) | Daily | n/a (rating applies to each area) | All users |
| AFDRS (official) Indices and Ratings | Max Fire Behaviour Rating | Maximum Fire Behaviour Rating for the day. | AFDRS | AFDRS text product | Daily | 1.5 km | All users |
| McArthur (unofficial) Indices and Ratings | FDI Forest | Forest Fire Danger Index expresses fire risk and behaviour for forest fuels. Inputs include temperature, relative humidity, average wind speed at 10 m and fuel availability (drought factor). | TSU | Victorian FDI calculator (TBC) | Hourly | 3 km | All users |
| McArthur (unofficial) Indices and Ratings | FDI Grass | Grass Fire Danger Index expresses fire risk and behaviour for grass fuels. Inputs include temperature, relative humidity, average wind speed at 10 m and fuel condition (curing). | TSU | Victorian FDI calculator (TBC) | Hourly | 3 km | All users |
| McArthur (unofficial) Indices and Ratings | FDI Hourly Combined FFDI & GFDI | A combined map of forest and grass FDI. The FDI displayed for each cell is based on the predominant fuel type for that cell. To determine which fuel type applies to a cell of interest – open the expanded cell data pop-up and compare the FDI forest and FDI grass values to the FDI Hourly Fuel Based. | TSU | Victorian FDI calculator (TBC) | Hourly | 3 km | All users |
| McArthur (unofficial) Indices and Ratings | McArthur FDR per BOM District | For agency use only. The forecast OLD FDRs (based on McArthur system, not AFDRS) for each BOM weather district calculated from the highest maximum fuel based FDI that applies to at least 10% of the BOM weather district for that day. | CFA/TSU | Area rating calculator (TBC) | Daily | n/a (rating applies to each area) | All users |
| McArthur (unofficial) Indices and Ratings | McArthur FDR per ICC | For agency use only. The forecast OLD FDRs (based on McArthur system, not AFDRS) for each Incident Control Centre footprint calculated from the highest maximum fuel based FDI that applies to at least 10% of the ICC footprint for that day. | CFA/TSU | Area rating calculator (TBC) | Daily | n/a (rating applies to each area) | All users |
| McArthur (unofficial) Indices and Ratings | McArthur FDR per LGA | For agency use only. The forecast OLD FDRs (based on McArthur system, not AFDRS) for each Local Government Area calculated from the highest maximum fuel based FDI that applies to at least 10% of the LGA for that day. | CFA/TSU | Area rating calculator (TBC) | Daily | n/a (rating applies to each area) | All users |
| Fire Behaviour | Rate of Spread | The forecast rate of spread is the hourly rate of spread (m/h) at the selected time, defining the rate at which the head fire travels. | AFDRS | AFDRS gridded product / IDZ10138 | Hourly | 1.5 km | All users |
| Fire Behaviour | Fire Intensity | Byram’s fire-line intensity. The intensity (kW/m) at the front of the fire. | AFDRS | AFDRS gridded product / IDZ10139 | Hourly | 1.5 km | All users |
| Fire Behaviour | Flame Height | The flame height (m) is the average height of flames above ground height in the head fire. | AFDRS | AFDRS gridded product / IDZ10141 | Hourly | 1.5 km | All users |
| Fire Behaviour | Spotting Distance | Only calculated for forest fuel types, in metres. | AFDRS | AFDRS gridded product / IDZ10142 | Hourly | 1.5 km | All users |
| Fire Behaviour | AFDRS Fire Behaviour Model | A simplification of the AFDRS fuel type map into the 8 fire behaviour models | DELWP | Bushfire Fuel Dataset | n/a (updated infrequently) | 1.5 km | All users |
| Fire Behaviour | Head Fire Intensity (FireMod) | Headfire Intensity indicates how intense an established fire is likely to be. Specifically, it displays the rate of heat release per unit length of flame combustion extending from the leading edge of the fire front to the rear of the flaming zone. | DELWP – TSU | FireMod* | Hourly | 3 km | All users |
| Fire Behaviour | Minutes to 5 Hectares (FireMod) | Indicates the likely number of minutes it would take for a point source ignition to reach five hectares in size. | DELWP – TSU | FireMod* | Hourly | 3 km | All users |
| Fire Behaviour | Ventilation Index | Indicates the potential of the atmosphere to disperse airborne pollutants such as smoke in the lower atmosphere (from 0 m to 3000 m). | DELWP – TSU | FireMod* | Hourly | 3 km | All users |
| Fuel State | AFDRS Fuel Type (1.5km resolution) | The fuel type used to calculate fire behaviour and danger in each grid cell. There are 23 different fuel types available. | AFDRS | AFDRS gridded product / IDZ10161 | n/a (updated infrequently) | 1.5 km | All users |
| Fuel State | Phoenix Fuel Type (60m resolution) | The fuel type used to calculate fire spread using the Phoenix software. | DELWP | Bushfire Fuel Dataset | n/a (updated infrequently) | 60 m | All users |
| Fuel State | Modelled Overall Fuel Hazard (Phoenix) | The overall fuel hazard scores (using Overall Fuel Hazard Assessment Guide, 4th edition2) as modelled by DELWP. | DELWP | Bushfire Fuel Dataset | n/a (updated infrequently) | 60 m | All users |
| Fuel State | Modelled Total Fuel Load (Phoenix) | Modelled total fine fuel load (t/ha) using fuel types and time since fire data. | DELWP | Bushfire Fuel Dataset | n/a (updated infrequently) | 60 m | All users |
| Fuel State | Drought Factor | An indicator of the fuel drying trend. Specifically, it gives a measure of the proportion of fine fuel that is flammable based on the degree of rainfall versus the rate of drying over the last 20 days. | BOM | Gridded Weather^ / IDV71127 | Three-hourly | 3 km | All users |
| Fuel State | KBDI | Indicates the level of drought affecting vegetation. Specifically, it is a measure of the cumulative moisture deficiency in the upper soil layers (top 200 mm of the soil profile). KBDI is used as an input when determining the Drought Factor. | BOM | Gridded Weather^ / IDV71147 | Daily (from 11am) | 3 km | All users |
| Fuel State | Curing | A measure of the amount of fuel available to combust or the percentage of dead material in grasslands. Based on data supplied from CFA to the AFDRS and then trimmed and modified by DELWP. | TSU | Weather data system (TBC) / modified from BOM IDZ10148) | Daily | 3 km | All users |
| Fuel State | Slope | Slope of the ground surface in 1 degree intervals | DELWP | eMap | n/a (updated infrequently) | 30 m | All users |
| Fuel State | Grass Fuel Condition | Whether the grass fuel is natural (3), grazed (2) or eaten out (1) | AFDRS (from CFA) | AFDRS gridded product / IDZ10149 | n/a (updated infrequently) | 1.5 km | All users |
| Fuel State | Grass Fuel Load | Load (t/ha) of grass fuels (default is 4.5 t/ha) | AFDRS (from CFA) | AFDRS gridded product / IDZ10159 | n/a (updated infrequently) | 1.5 km | All users |
| Fuel State | Time Since Fire | Years since grid cell was burned by a bushfire or planned burn. | AFDRS (from DELWP) | AFDRS gridded product / IDZ10162 | n/a (updated infrequently) | 1.5 km | All users |
| Weather | Temperature | Ambient air temperature at ground level. | BOM | Gridded Weather^ / IDV71000 | Hourly | 3 km | All users |
| Weather | Relative Humidity | The most commonly used measure of atmospheric moisture and is defined as the ratio of the amount of water vapour measured to that which air could hold at saturation. | BOM | Gridded Weather^ / IDV71018 | Hourly | 3 km | All users |
| Weather | Dew Point | A measure of the moisture content of the air and is the temperature to which air must be cooled for dew to form. | BOM | Gridded Weather^ / IDV71001 | Hourly | 3 km | All users |
| Weather | Wind Speed at 10m | The 10-minute averaged wind speed, based on a 10-metre standard height. Wind gusts can be 40 percent stronger than the average speeds presented. | BOM | Gridded Weather^ / IDV71006(3) | Hourly | 3 km | All users |
| Weather | Wind Speed at 1500m | Wind magnitude at 1500m above sea level in km/h | BOM | Gridded Weather^ / IDV71110 | Hourly | 3 km | All users |
| Weather | Wind Gust at 10m | Wind gust at surface level | BOM | Gridded Weather^ / IDV71072 | Hourly | 3 km | All users |
| Weather | Daily Precipitation (25%) | Amount of rainfall (mm) for which there is a 25% chance of exceeding in the 24 hours from 15UTC | BOM | Gridded Weather^ / IDV71014 | Daily | 3 km | All users |
| Weather | Daily Precipitation (50%) | Amount of rainfall (mm) for which there is a 50% chance of exceeding in the 24 hours from 15UTC | BOM | Gridded Weather^ / IDV71015 | Daily | 3 km | All users |
| Weather | 3-Hourly Precipitation (25%) | Minimum amount of precipitation forecast with 25% certainty | BOM | Gridded Weather^ / IDV71032 | Three-hourly | 3 km | All users |
| Weather | 3-Hourly Precipitation (50%) | Minimum amount of precipitation forecast with 50% certainty | BOM | Gridded Weather^ / IDV71033 | Three-hourly | 3 km | All users |
| Weather | Cloud Cover | A measure of the percentage of cloud cover in the atmosphere. | BOM | Gridded Weather^ / IDV 71017 | Hourly | 3 km | All users |
| Weather | Continuous Haines | An indicator of atmospheric instability and dryness. These factors contribute to plume dynamics, so the Continuous Haines (C-Haines) shows where there is potential for the development of a significant smoke column, plume-dominated fire and/or a pyrocumulonimbus event. | BOM | Gridded Weather^ / IDV71115 | Three-hourly | 3 km | All users |
| Weather | Mixing Height | A measure of the upper height, in metres above sea level, to which the lower atmosphere will undergo mixing (mechanical or turbulent) resulting in a nearly uniform air mass. | BOM | Gridded Weather^ / IDV71109 | Hourly | 3 km | All users |
| Weather | Lightning Activity Level | A measure of the likelihood and amount of lightning from 0 (No lightning) to 3 (Widespread lightning) | BOM | Gridded Weather^ / IDV71114 | Three-hourly | 3 km | All users |
| Weather overlays | BOM Weather Stations | Locations of Automatic Weather Stations (AWS) and other non-automatic weather stations from which the BOM collects observation data. AWS generally provide observations every half hour. Non-AWS data is less frequent (e.g. twice daily). | BOM | BOM observations | n/a | n/a | All users |
| Weather overlays | Fuel Moisture Stations | Locations of FFMVic fuel moisture stations where weather variables, fuel moisture and soil moisture data are collected. | DELWP | Fuel Monitoring Portal | n/a | n/a | All users |
| Weather overlays | Wind at 10m Animated | An animated representation of forecast wind particle movement. Produced using the gridded weather forecast. | BOM | Gridded Weather^ | Hourly | 3 km | All users |
| Weather overlays | Wind at 10m Barbs | A combined indicator of forecast wind speed (10-minute averaged wind speed, based on a 10-metre standard height) and wind direction. | BOM | Gridded Weather^ | Hourly | 3 km | All users |
| Incidents | DELWP/CFA Bushfires | Recorded fire incidents in Victoria | DELWP | eMap | n/a | n/a | All users |
| ^Gridded Weather The Gridded Weather is a compilation of datasets (NetCDF files) of forecast weather variables for the present day and the week ahead. The Gridded Weather is produced by the BOM using the Graphic Forecast Editor (GFE) system. The Gridded Weather for Victoria is produced at a 3km resolution using data sourced from a range of global weather forecasting models. The Gridded Weather data files are updated twice daily. A full update of all days in the forecast period occurs in the afternoon update. The morning update (usually completed by 6am) provides updated NetCDF files where only the data for the current day has been updated.*FireMod FireMod uses the Gridded Weather, together with fuel and topography datasets, to calculate a range of forecast fire weather and fire behaviour spatial data sets. The FireMod system is maintained by TSU within Forest, Fire and Regions at DELWP. FireMod will be triggered to run when the BOM release updated Gridded Weather.Footnotes2 Hines F.,Tolhurst K.G., Wilson A.A.G. & McCarthy G.J. 2010. Overall fuel hazard assessment guide, 4th edition July 2010. Fire and adaptive management, report no. 82. Victorian Government Department of Sustainability and Environment. Melbourne, Australia.3 The wind speed product currently being used is IDV71006 (Wind_Mag_SFC), which is Wind speed for specified time (Hourly) (knots or m/s). This has been converted into km/h in the Foresight code. |
Accessing the charts/graphs
When an indicator layer is selected and displayed on the map, there are a few methods of accessing more information about a point of interest. If you select a point on your map with your cursor, then the pop-up box will appear and you can select the ‘charts/graphs’ option to access meteograms for that location, by selecting the graphic on the bottom left-hand side of the pop-up (Figure 4).
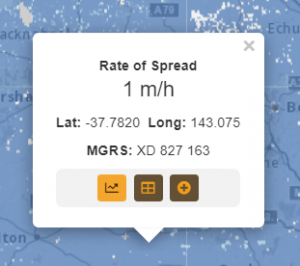
Figure 4. Pop-up box at a point location on the map display, showing the charts function selected.
A data display window will pop-up at the right side of the screen. At the top of the data window, information related to the location of the selected point will be displayed, specifically Latitude, Longitude, MGRS Coordinate System location and Phoenix Fuel Type for that location.
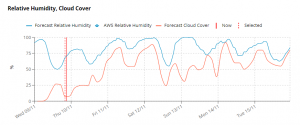
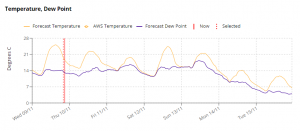
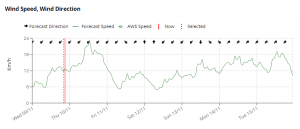
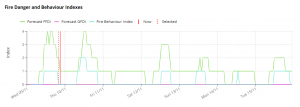
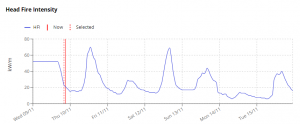
Figure 5. Meteogram window (Zoom for improved resolution)
Within each meteogram, the selected date and time is represented by a dashed red line (Figure 6). The solid red line shows the current date and hour (now).
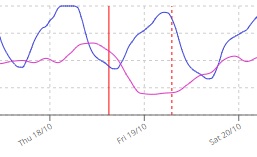
Figure 6. Now and selected time steps
Scrolling over a data point in a meteogram will reveal the numerical value for that indicator at that time step (Figure 7).
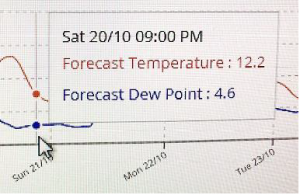
Figure 7. Data will appear upon scrolled over
At the top of the meteograms, click ‘Show’ on the ‘History’ button to switch on/off the visibility of the two days prior to the present within the meteograms. Use the ‘Days’ button to switch between visibility of a two-day or seven-day forecast period within the meteograms (Figure 8).
![]()
Figure 8. The header page of pop-up meteogram and chart box, showing the history and days functions (Zoom for improved resolution)
AWS are fully automated BOM weather stations that collect a large set of weather variables according to stringent methods. Data is reported on a half hour frequency (Figure 9). Non-AWS are weather stations that generally collect fewer variables and data is usually reported less frequently (e.g. twice daily). Portable weather stations will also appear if any have been deployed in the state.
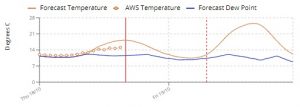
Figure 9. AWS observation data in a meteogram
If a weather station is within 10km of the selected point, then observation data for the nearest weather station is also shown on the meteogram. This allows comparison of the forecast (predicted) conditions against the observed weather (actual) at the nearby weather station. This is important for helping to assess the reliability of the forecast.
Accessing the data tables
You can also access data tables for the selected point, by selecting the ‘Tables’ option on the bottom middle of the pop-up (Figure 10).
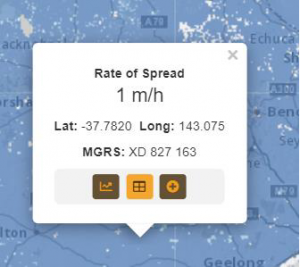
Figure 10. Pop-up box at a point location on the map display, showing the tables function selected.
When you access the data tables, all Foresight versions will present a data table of weather variables (Figure 12). This table data can display forecast history, in the same way as the meteograms. You can also toggle between the meteograms and the data table using the ‘Graphs-Table’ toggle option at the top of the data display screen. The left side of the data table allows display functions to be activated. Background colours can be selected to add legend colours into the table cells according to values, and the wind direction information can be changed to arrows, cardinals or degrees. You can also move the time at the top of the table between ‘now’ and a selected time step.
The weather variables displayed in the data tables are consistent across all Foresight products. All users can manually edit variables that are used in any fire behaviour models. This is done by double-clicking on a data table cell of interest or on the ‘edit’ icon (![]() ) for the relevant row or column. This will open a pop-up which allows all values contributing to the calculation of that data cell to be edited (Figure 11). Any data that is dependent on edited data will be highlighted in the data table and the map.
) for the relevant row or column. This will open a pop-up which allows all values contributing to the calculation of that data cell to be edited (Figure 11). Any data that is dependent on edited data will be highlighted in the data table and the map.
The weather variables displayed in the data table are shown in Table 4.
Table 4. List of weather variables in data tables
| Weather variable | Additional information |
| Temperature | Degrees Celsius |
| Relative humidity | % |
| Wind direction | Degrees, with visualisation in data table able to be edited |
| Wind speed at 10m | Km/h |
| Wind speed at 1500m | Km/h |
| Continuous Haines | Whole numbers between 0 and 13 |
| Drought Factor | Entire column able to be edited using edit function in column header |
| KDBI | 0-200 |
| Curing | %, entire column able to be edited using edit function in column header |
| Cloud cover | % |
| Dew point | Degrees Celsius |
| FDI – Forest | Calculated by TSU from BOM data |
| FDI – Grass | Calculated by TSU from BOM data |
| FBI | Accessed from AFDRS |
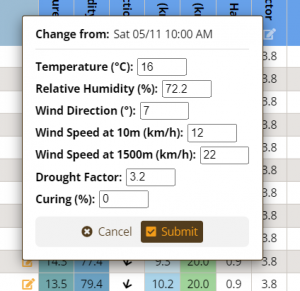
Figure 11. Pop-up box that appears when hovering cursor above a data cell in the data table. All fields can be edited for that cell.
The export function (![]() ) to the right side of the Data Set options allows you to export the data tables in several different formats, for printing or import into other programs.
) to the right side of the Data Set options allows you to export the data tables in several different formats, for printing or import into other programs.
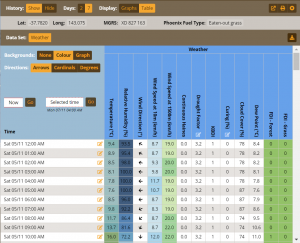
Figure 12. Data table of weather variables available in all Foresight products (Zoom for improved resolution)